
Simon Coupland, De Montfort University
Immersive or Block delivery is a growing delivery mode in the Higher Education sector within the UK and beyond (Jones, 2022). My own institution (De Montfort University, Leicester) underwent a radical transformation, moving to a model of 7-week 30 credit modules delivered sequentially (Coupland et al, 2024). The majority of students value focusing on a single topic at a time, however, staff opinions differ. Many, including myself, enjoy the focus the immersive timeframe brings, others find it challenging to give enough space for student reflection and self-direction. I set myself what on the surface seems like an additional challenge of facilitating continuous assessment and feedback to a group of around 40 students in a level 6 module. Far from being a burden, I found this approach to be less stressful and that my productivity when marking improved. My approach and experience are detailed in the rest of this article.
Whilst modules may be delivered sequentially, they are not silos. My module (GAMR3521) builds on the module that immediately precedes it (GAMR3531). GAMR3521 teaches students rendering techniques for drawing 3D scenes in computer games using programmes called shaders on the Graphics Processor Unit (GPU). My module follows on from this, focusing on techniques to improve rendering performance, allowing more detailed graphics with the same computer hardware.
The table below is a comparison of the two modules:
| GAMR3521 | GAMR3531 | |
| Content | Implementing graphics techniques: models, lighting, shadows, particles. Advanced GPU use: compute, geometry and tessellation. | Measuring performance by profiling CPU and GPU. Performance improvement techniques: spatial partitioning, culling, move to compute. |
| Assessment | Code assessed at the end of the module. Technically demonstrate up to 11 techniques which build on each other. One-to-one conversation with tutor, a deep dive into two techniques. | Code and experiments continuously assessed. Experiment with up to 11 techniques, to be chosen by the student. Submit code and (short) report. Assessed digital metadata trail, quality of code documentation and optionally, presenting to the class. |
| Delivery | Same staff, students and delivery, 6 weeks with 10 hours per week, week 7 is for independent working. Common software and tools. |
Students are presented with two new techniques every week. The idea with continuous assessment is that students can treat each half week as a short iterative sprint where the work is completed and feedback received. If they wish to, they can improve their work based on the feedback and resubmit it. In an ideal scenario the process would follow the diagram in Figure 1.
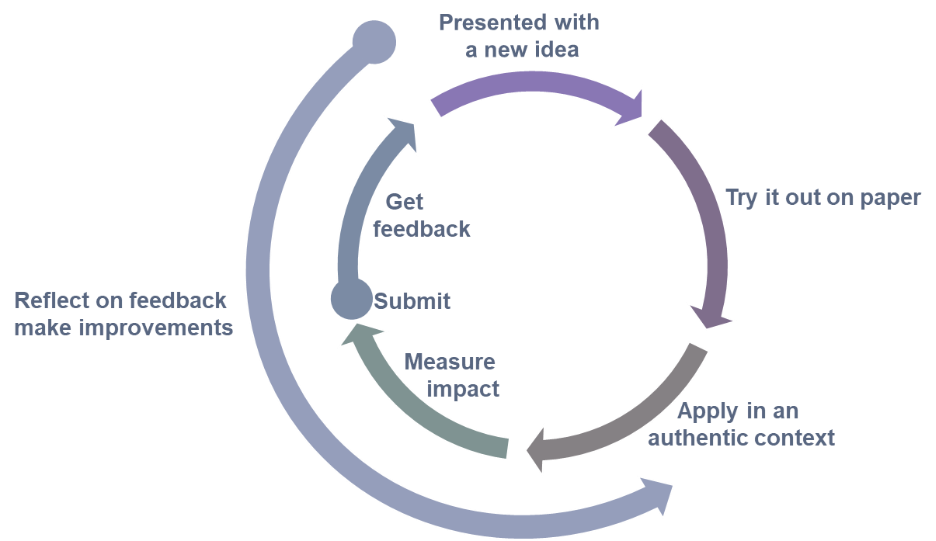
Figure 1: A model of student activity with continuous assessment on GAMR3531.
We’ll move on to look at how this model affected student behaviour and what this meant for wellbeing. We have two sets of data to consider. The students on both modules created a digital trail as they worked (commits), essentially the metadata from saving their work to a centralised server. This gives a direct comparison between a measure of effort on the two modules. For GAMR3532 we also have date of each experiment report submission. The graph depicted in Figure 2 plots all this data by week.
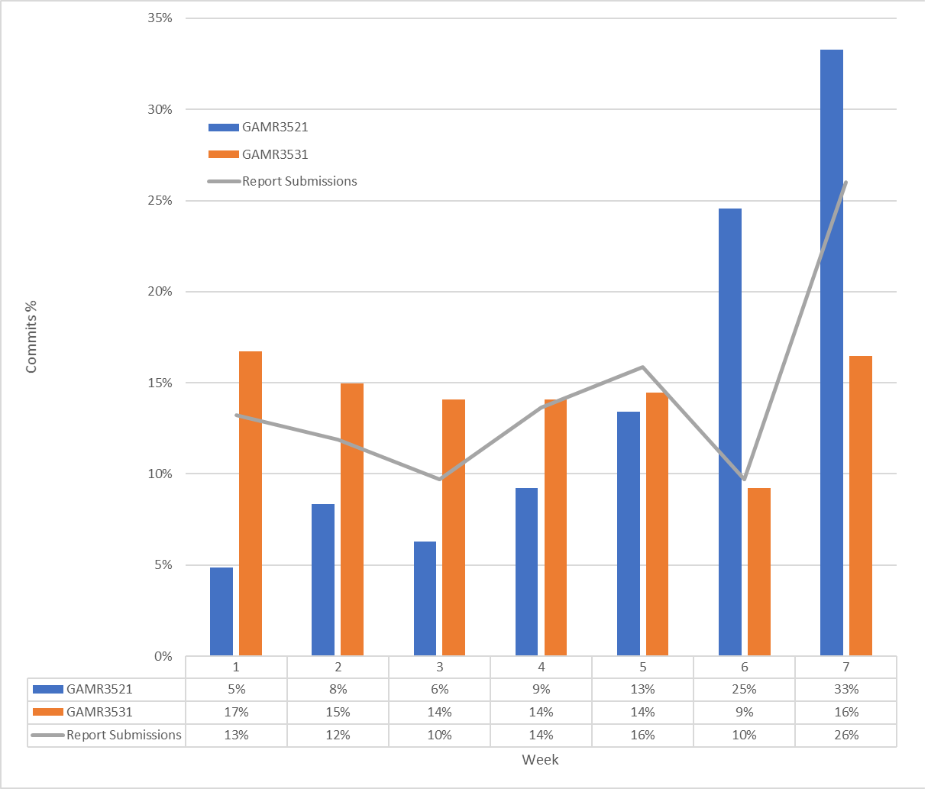
Figure 2: A comparison of commit data for both modules with a plot of report submission data.
Clearly, students worked more consistently when being assessed continuously. GAMR3532 still shows some end of module crunch as evidence by the report submission. It is worth delving a little deeper into the report submission data with a second graph depicted in Figure 3.
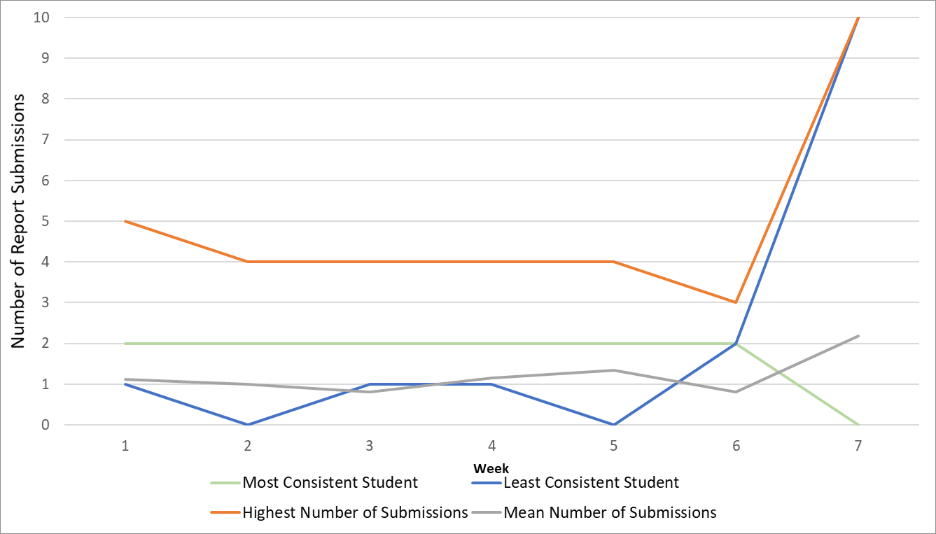
Figure 3: A comparison of student report submission rates.
We can see the most consistent student is pretty much the model student with 12 submissions, 2 per week for 6 weeks. The least consistent student did some work early on but mostly crammed at the end of the module. The range and mean of submissions show most students worked consistently with a small push at the end of the module. This tallies with my experience leading the module.
This isn’t a large module and perhaps it is slightly niche in that the subject area already uses metadata for assessment (Coupland et al, 2025) and checking coursework provenance (Coupland, S., 2024). However, there are somethings worthy of note here.
Students worked more consistently and with less end of module crunch when assessed continuously. This must be good for wellbeing. Students certainly enjoyed this approach with comments such as “The report system is really good because you can see your mark in real time and know if you are in track for the mark you are aiming for.” and “The continuous assessment in block worked really well, me and my peers really found it beneficial.”
Clearly, continuous assessment in immersive delivery is possible. The marking load is not overwhelming, in fact, I felt marking productivity was much higher as I knew exactly what I was looking for in each small submission. A side note is that I had much lower anxiety about student performance, I knew exactly how the cohort was doing, and which students needed a little encouragement to engage.
References
Coupland, S., Fahy, C., Stuart, G., and Allman, Z. (2025) A data-driven approach to student support using formative feedback and targeted interventions. In: Elkington, S. and Irons, A. (Eds) Formative Assessment and Feedback in Post-Digital Learning Environments, Oxon: Routledge, pp. 179-185
Coupland, S., Allman, Z., Khuman, A., Fahy, C., & Attwood, L. (2024). Sprinting into blocks: what computing, AI and gaming academics learned. In Times Higher Education. https://www.timeshighereducation.com/campus/sprinting-blocks-what-computing-ai-and-gaming-academics-learned
Coupland, S. (2024). Assessing the Provenance of Student Coursework. the 7th Enhancing Student Learning Through Innovative Scholarship Conference (ESLTIS). St Andrews University.
Jones, S. (2022). Blocks for building a stronger student community. In Times Higher Education. https://www.timeshighereducation.com/campus/blocks-building-stronger-student-community
Nunes, J.C. and Dreze, X., 2006. The endowed progress effect: How artificial advancement increases effort. Journal of Consumer Research, 32(4), pp.504-512.
Image: https://pixabay.com/illustrations/ai-generated-gears-mechanism-8896683/

